逆向分析中,钩取Hoonking是一种截取程序信息,更改程序执行流向、往程序添加新功能的技术。钩取Hoonking技术实施流程:
- 使用反汇编器/调试器把握程序结构与工作原理
- 开发需要“钩子”代码,用于修改Bug、改善程序功能
- 灵活操作可执行文件与进程内存,设置“钩子”代码
这里贴一下书中相关的Hook技术图表

下边演示的是技术图表中

背景介绍
操作系统出于诸多的安全考量会禁止用户程序直接访问相关的系统资源。当用户需要使用这些资源时,必须向系统内核Kernel申请,申请的“窗口”就是Win32 API。为实际运行程序代码,需要加载许多系统库(DLL)。所有进程都会默认加载kernel32.dll库,kernel32.dll又会加载ntdll.dll库
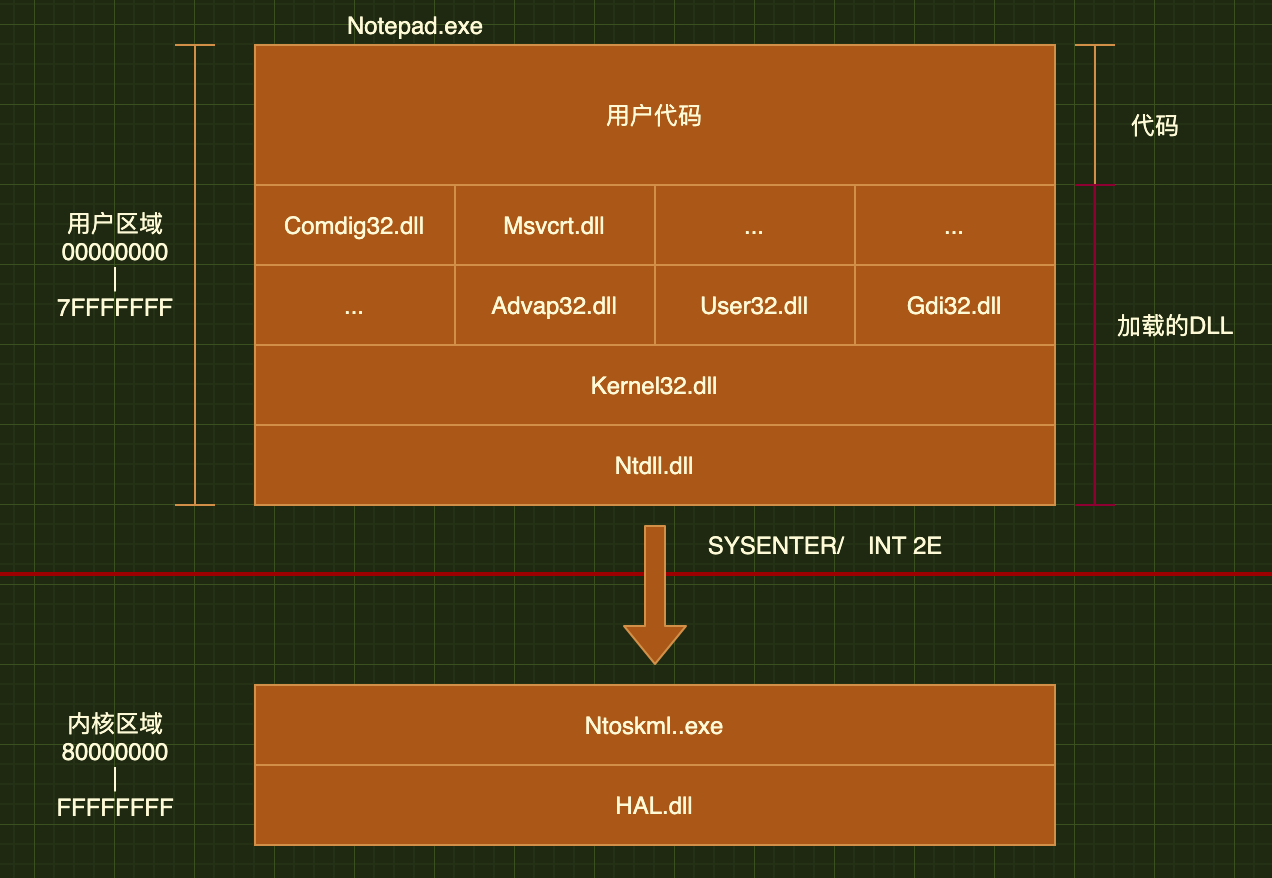
上述示意图表明使用常规系统资源的API会经由kernel32.dll与ntdll.dll不断向下调用,最后通过SYSENTER命令进入内核模式。
至此,我们了解了系统从用户区域试图访问系统资源需要经过WIN32 API的调用,通过这个窗口进入内核区域,执行完相关资源的访问后会到用户区域(处于安全考量)。这里如果以notepad.exe使用到的API CreateFile为例,会是如下的示意图:

这是由于notepad.CreateFIle是系统级DLL文件Kernel32.dll提供给notepad.exe使用的,即Kernel32.dll提供了接口以供用户程序notepad.exe使用。因此,当notepad.CreateFile调用发生,透过接口向系统提出访问申请,再由Kernel32响应,若成功,则进入内核,访问相应的资源。
API Hooking
通过API钩取技术可以实现对某些Win32 API调用过程的拦截,并获得相应的控制权限。事实上该技术是比较通用的,想要截取哪个函数就编写相应的Hook function即可。因此该技术使用极为广泛。
本节讨论的是使用该技术用于钩取Win32 API,达到的效果如下:

可以看到使用hook技术,原本notepad.CreateFile是直接交给Kernel32.CreateFIle处理的,现在需要经过Hook.MyOwnCreateFile。这里边可以做的事情挺多的,例如可能程序想创建一个名为note.txt的无害文件的,被Hook.MyOwnCreateFile处理后实际递交到Kernel32.CreateFile的请求时创建一个名为webshell.php的文件,作用可见一斑。
那么问题的关键来了,上述程序执行流程怎么做到的?技术细节如何?带着疑问,开始下文吧!
调试器Hook
在开始第一部分的相关内容之前,有必要了解一下调试器的工作原理:
- 被调试进程经过注册后,每当被调试者触发
调试事件(Debug Event)时,OS会暂停其运行并向调试器报告相应事件。 - 调试器对相应事件做出处理后,执行权交回被调试进程,被调试进程接着程序执行
需要指出的是:
- 若相应进程处于非调试状态,调试事件会优先在其自身内部的异常处理机制进行处理,自带的异常处理机制无法处理时则交由OS的异常处理机制进行处理,大多数交付OS异常处理会是程序终止
- 调试器对于不关心的
调试事件(Debug Event)是不做处理的,直接交付OS处理。

与调试相关的调试事件为:EXCEPTION_DEBUG_EVENT 与调试相关的异常事件为:EXCEPTION_BREAKPOINT异常。具体调试事件&异常事件查看相关文档
其中EXCEPTION_BREAKPOINT断点异常是比较常作为该技术触发的异常,断点对应的汇编指令为INT 3,IA-32指令为0xCC。当程序指令执行到INT 3 EXCEPTION_BREAKPOINT断点异常被触发,此时程序的执行控制权会给到调试器,这也是调试器钩取方式的原理 – 修改感兴趣的代码对应的指令字节码第一个字节为0xCC,执行完Hook function的内容后恢复修改的字节,转交程序执行控制权即可。
预备知识
开始相关内容之前,需要补一些预备知识
DebugEvent调试事件
DEBUG_EVENT是一个结构体,相关描述参见文档原型如下:
1 | typedef struct _DEBUG_EVENT { |
DebugEvent编号
| Value | Meaning |
|---|---|
| CREATE_PROCESS_DEBUG_EVENT3 | Reports a create-process debugging event (includes both a process and its main thread). The value of u.CreateProcessInfo specifies a CREATE_PROCESS_DEBUG_INFO structure. |
| CREATE_THREAD_DEBUG_EVENT2 | Reports a create-thread debugging event (does not include the main thread of a process, see CREATE_PROCESS_DEBUG_EVENT). The value of u.CreateThread specifies a CREATE_THREAD_DEBUG_INFO structure. |
| EXCEPTION_DEBUG_EVENT1 | Reports an exception debugging event. The value of u.Exception specifies an EXCEPTION_DEBUG_INFOstructure. |
| EXIT_PROCESS_DEBUG_EVENT5 | Reports an exit-process debugging event. The value of u.ExitProcess specifies an EXIT_PROCESS_DEBUG_INFOstructure. |
| EXIT_THREAD_DEBUG_EVENT4 | Reports an exit-thread debugging event. The value of u.ExitThread specifies an EXIT_THREAD_DEBUG_INFOstructure. |
| LOAD_DLL_DEBUG_EVENT6 | Reports a load-dynamic-link-library (DLL) debugging event. The value of u.LoadDll specifies a LOAD_DLL_DEBUG_INFO structure. |
| OUTPUT_DEBUG_STRING_EVENT8 | Reports an output-debugging-string debugging event. The value of u.DebugString specifies an OUTPUT_DEBUG_STRING_INFO structure. |
| RIP_EVENT9 | Reports a RIP-debugging event (system debugging error). The value of u.RipInfo specifies a RIP_INFOstructure. |
| UNLOAD_DLL_DEBUG_EVENT7 | Reports an unload-DLL debugging event. The value of u.UnloadDll specifies an UNLOAD_DLL_DEBUG_INFOstructure. |
后面遇到了详细说
ReadProcessMemory
1 | BOOL ReadProcessMemory( |
从API名称不难判断大致完成的功能:选取目标进程hProcess的偏移位置lpBaseAddress为起始读取nSize的内容,存放的位置为lpBuffer。至于第五个参数lpNumberOfBytesRead则是用于写入内容到指定变量的地址,为NULL则该字段无效。
WriteProcessMemory
1 | BOOL WriteProcessMemory( |
选取目标进程hProcess的偏移位置lpBaseAddress为起始写入nSize的内容,待写入内容的存放位置为lpBuffer。至于第五个参数lpNumberOfBytesRead则是用于写入内容到指定变量的地址,为NULL则该字段无效。
DebugLoop
EXCEPTION_RECORD
是一个结构体,描述着一个异常的信息。
1 | typedef struct _EXCEPTION_RECORD { |
这里就不全介绍,更多的请读者自行查看文档,介绍第一个参数:ExceptionCode的部分异常码:
| Value | Meaning |
|---|---|
| EXCEPTION_ACCESS_VIOLATION | The thread tried to read from or write to a virtual address for which it does not have the appropriate access. |
| EXCEPTION_ARRAY_BOUNDS_EXCEEDED | The thread tried to access an array element that is out of bounds and the underlying hardware supports bounds checking. |
| EXCEPTION_BREAKPOINT | A breakpoint was encountered. |
| EXCEPTION_FLT_DIVIDE_BY_ZERO | The thread tried to divide a floating-point value by a floating-point divisor of zero. |
| EXCEPTION_FLT_OVERFLOW | The exponent of a floating-point operation is greater than the magnitude allowed by the corresponding type. |
| EXCEPTION_FLT_STACK_CHECK | The stack overflowed or underflowed as the result of a floating-point operation. |
| EXCEPTION_SINGLE_STEP | A trace trap or other single-instruction mechanism signaled that one instruction has been executed. |
| … | … |
CONTEXT
结构体,包含程序执行上下文的一些信息(寄存器等),字段很多,篇幅限制,不po出来了。只介绍后文需要用到的CONTEXT.ContextFlags ,含义是在查询的时候需要设置该字段,表示查询哪些其他的CONTEXT结构字段。后文使用到的值CONTEXT_CONTROL表明想查看的CONTEXT内容是控制寄存器组CONTEXT_CONTROL
源码
这里先贴完整源码,再逐部分进行分析
1 |
|
main部分
1 | int main(int argc, char* argv[]) |
- 第4行,检查参数
- 第11行,转化从命令行接收到的参数为int类型
- 第12行,对
dwPID调用DebugActiveProcess,该API作用:Enables a debugger to attach to an active process and debug it.使得目标进程能够被其他DebugFunction捕获,其实就是设置目标而已。 - 第18行,启用
DebugLoop,往下分析DebugLoop
DebugLoop
1 | void DebugLoop() |
WaitForDebugEvent:写在DebugLoop的开始,作用是等待被调试者的调试事件发生,函数原型:
1 | BOOL WaitForDebugEvent( |
含义是再dwMilliseconds时间区间内等待被调试程序中的调试事件。参考文档,发现当dwMilliseconds = INFINITE 则意味着无限等待,直至被调试者触发异常事件,异常事件存放在lpDebugEvent
dwContinueStatus是配合后面的ContinueDebugEvent使用的,相关文档 函数原型:
1 | BOOL ContinueDebugEvent( |
dwContinueStatus 是为了配合DebugLop中的ContinueDebugEvent使用
配合
ContinueDebugEvent,使得系统允许调试唤起先前由于异常事件而挂起的线程。当ContinueDebugEvent.dwContinueStatus则决定了以什么方式唤起被挂起的线程(dwThreadId):
DBG_CONTINUE:如果ContinueDebugEvent唤起的dwThreadId线程此前报告了EXCEPTION_DEBUG_EVENT异常事件,则意味着停止所有异常处理并进行进程运行,对于任何其他调试事件,此标志意味着继续执行线程。(放行)DBG_EXCEPTION_NOT_HANDLED:如果ContinueDebugEvent唤起的dwThreadId线程此前报告了EXCEPTION_DEBUG_EVENT异常事件,则意味着进行相应的异常处理。(处理)
回到WaitForDebugEvent,第7-31行完成的事循环等待DebugEvent发生,再根据DebugEvent的具体事件进行相应的处理。
CREATE_PROCESS_DEBUG_EVENT
CREATE_PROCESS_DEBUG_EVENT == de.dwDebugEventCode,当调试事件是进程创建,执行OnCreateProcessDebugEvent(&de);执行内容如下:
1 | BOOL OnCreateProcessDebugEvent(LPDEBUG_EVENT pde) |
理解上述内容需要查找DebugEvent中的描述,上文提及了。这里观察CREATE_PROCESS_DEBUG_EVENT的描述,此时pde->u.CreateProcessInfo指向结构体CREATE_PROCESS_DEBUG_INFO保存当前进程的一些信息:
1 | typedef struct _CREATE_PROCESS_DEBUG_INFO { |
接着分析OnCreateProcessDebugEvent
第5行将这些信息copy一份到g_cpdi中。
第7、8行完成的是读取进程代码中Kernel32.WriteFIle API指令代码的第一个字节。
之所以可以这样操作是由于在系统中所有进程使用的都是同一份的
kernel32.dll因此调试器g_pfWriteFile = GetProcAddress(GetModuleHandleA("kernel32.dll"), "WriteFile");获取到的值对目标进程人就使用,指向的同为Kernel32.WriteFile
第9、10行完成的是在Kernel32.WriteFile的第一个字节写入中断指令0xCC
分析到这里,我们就知道了,当WaitForDebugEvent监听到的调试事件是目标进程的CREATE_PROCESS_DEBUG_EVENT时,则在目标进程的kernel32.WriteFile读取头字节内容,并写入中断指令。执行完CREATE_PROCESS_DEBUG_EVENT的响应返回true。
执行ContinueDebugEvent准备下一个DebugEvent的发生
EXCEPTION_DEBUG_EVENT
当目标进程触发EXCEPTION_DEBUG_EVENT调试事件,执行
1 | if( OnExceptionDebugEvent(&de) ) |
OnExceptionDebugEvent
1 | BOOL OnExceptionDebugEvent(LPDEBUG_EVENT pde) |
初步可见是判断当前的异常事件EXCEPTION_DEBUG_EVENT是否是断点异常EXCEPTION_BREAKPOINT
不是则return FALSE回到DebugLoop接着监听下一个DebugEvent,之所以如此是由于我们的目标是kernel32.WriteFile这一点我们在DebugEvent = CREATE_PROCESS_DEBUG_EVENT的响应时间中设置了目标API第一字节为断点异常EXCEPTION_BREAKPOINT了.
当异常事件是断点异常EXCEPTION_BREAKPOINT并且确实是我们设置好的位置g_pfWriteFile == per->ExceptionAddress时执行if为true的内容:
1 | if( g_pfWriteFile == per->ExceptionAddress ) |
第4、5行完成的是进行UnHook—恢复先前被Hook的API
Kernel32.WriteFile的第一个字节(g_chOrgByte)否则会陷入hook循环第8行设置
context.ContextFlags = CONTEXT_CONTROL表明想查看的CONTEXT内容是控制寄存器组第9行,按照设置的CONTEXT.ContextFlags进行执行上文信息的获取,获取的内容存放在
ctx中后面的代码是最能体现hook的意图的了。这里先查看下函数原型:
1
2
3
4
5
6
7
BOOL WriteFile(
[in] HANDLE hFile,
[in] LPCVOID lpBuffer,
[in] DWORD nNumberOfBytesToWrite,
[out, optional] LPDWORD lpNumberOfBytesWritten,
[in, out, optional] LPOVERLAPPED lpOverlapped
);第14-17行代码,根据ESP来索引APi的参数,读取了调用
kernel32.WriteFile的第二个参数(ESP+8)写入的目的地lpBuffer,第三额参数,写入的字节数nNumberOfBytesToWrite。可以猜到后续应该是修改这两个值,使得写入的位置,写入的长度发生变化,这就是Hook Function的行为第20、21行,可以看到申请了一块大小和上边取出的
kernel32.WriteFile大小相同的缓冲区lpBuffer(开始要搞事了),并使用0填充第24-26行,读取出原
kernel32.WriteFile要写入的内容,存放到lpBuffer,并进行打印第29-33行,将
lpBuffer中的小写字符转为大写第38、39行,将转化后的字符写入
kernel32.WriteFile的参数第46行,设置ctx.eip,执行正常API
kernel32.WriteFile调用,因为第一个字节内容被恢复了。第47行,设置线程执行上下文环境为ctx
第50、51行,恢复线程运行,
第54行,重新对
kernel32.WriteFile下hook,以便下次在此拦截API调用。return True
随后回到DebugLoop继续监听调试事件的发生
回顾
DebugActiveProcess设置目标进程为可调试状态启用
DebugLoopDebugLoop.WaitForDebugEvent监听目标进程触发的调试事件当调试事件=
CREATE_PROCESS_DEBUG_EVENT,进程创建标志触发,判断是目标后OnCreateProcessDebugEvent响应调试事件,下钩时机在OnCreateProcessDebugEvent内部,下钩步骤如下:- 保存即将要Hook的API的第一个字节的内容。
- 修改第一个字节内容为
断点异常0xCC,完成下钩
当调试事件=
EXCEPTION_DEBUG_EVENT,判定是目标出发的调试事件后OnExceptionDebugEvent响应,钩子函数作用时机在OnExceptionDebugEvent内部,若想重复钩取,则需要在钩子函数的最后重新下钩。